Plot
The API for creating Plot objects.
Note
The examples assume plotify is imported as follows:
import plotify as pl
plotify.BasePlot
__init__(self, title = '', height = 3900.0, width = 7200.0, dpi = 600.0, plot3d = False, border = True)
Description
Creates a Plot object.
Arguments
title: The title of the plot. Seeset_title.height: The height of the plot.width: The width of the plot.dpi: The resolution of the plot.plot3d: Whether the plot is a 3D plot or not.border: Whether to draw a thin black border around the frame of the plot.
Example
plot = pl.Plot('Title')
annotate(self, text, xytext, xylabel, rad = 0.0, shape = '->', width = 0.5, color = '#000000', *args, **kwargs)
arrow(self, start, end, width = 1.0, fill = None, color = None, linewidth = 1.0, *args, **kwargs)
Start and end are (z, y) tuples.
bar(self, x, y, show_values = False, num_box_sets = None, spacing = 1.0, center_ticks = False, *args, **kwargs)
box(self, x, y, show_values = False, num_box_sets = None, spacing = 2.0, center_ticks = False, *args, **kwargs)
circle(self, x, y, radius, fill = None, color = None, alpha = 0.5, linewidth = 1.5, *args, **kwargs)
close(self)
contour(self, x, y, z = None, fill = True, *args, **kwargs)
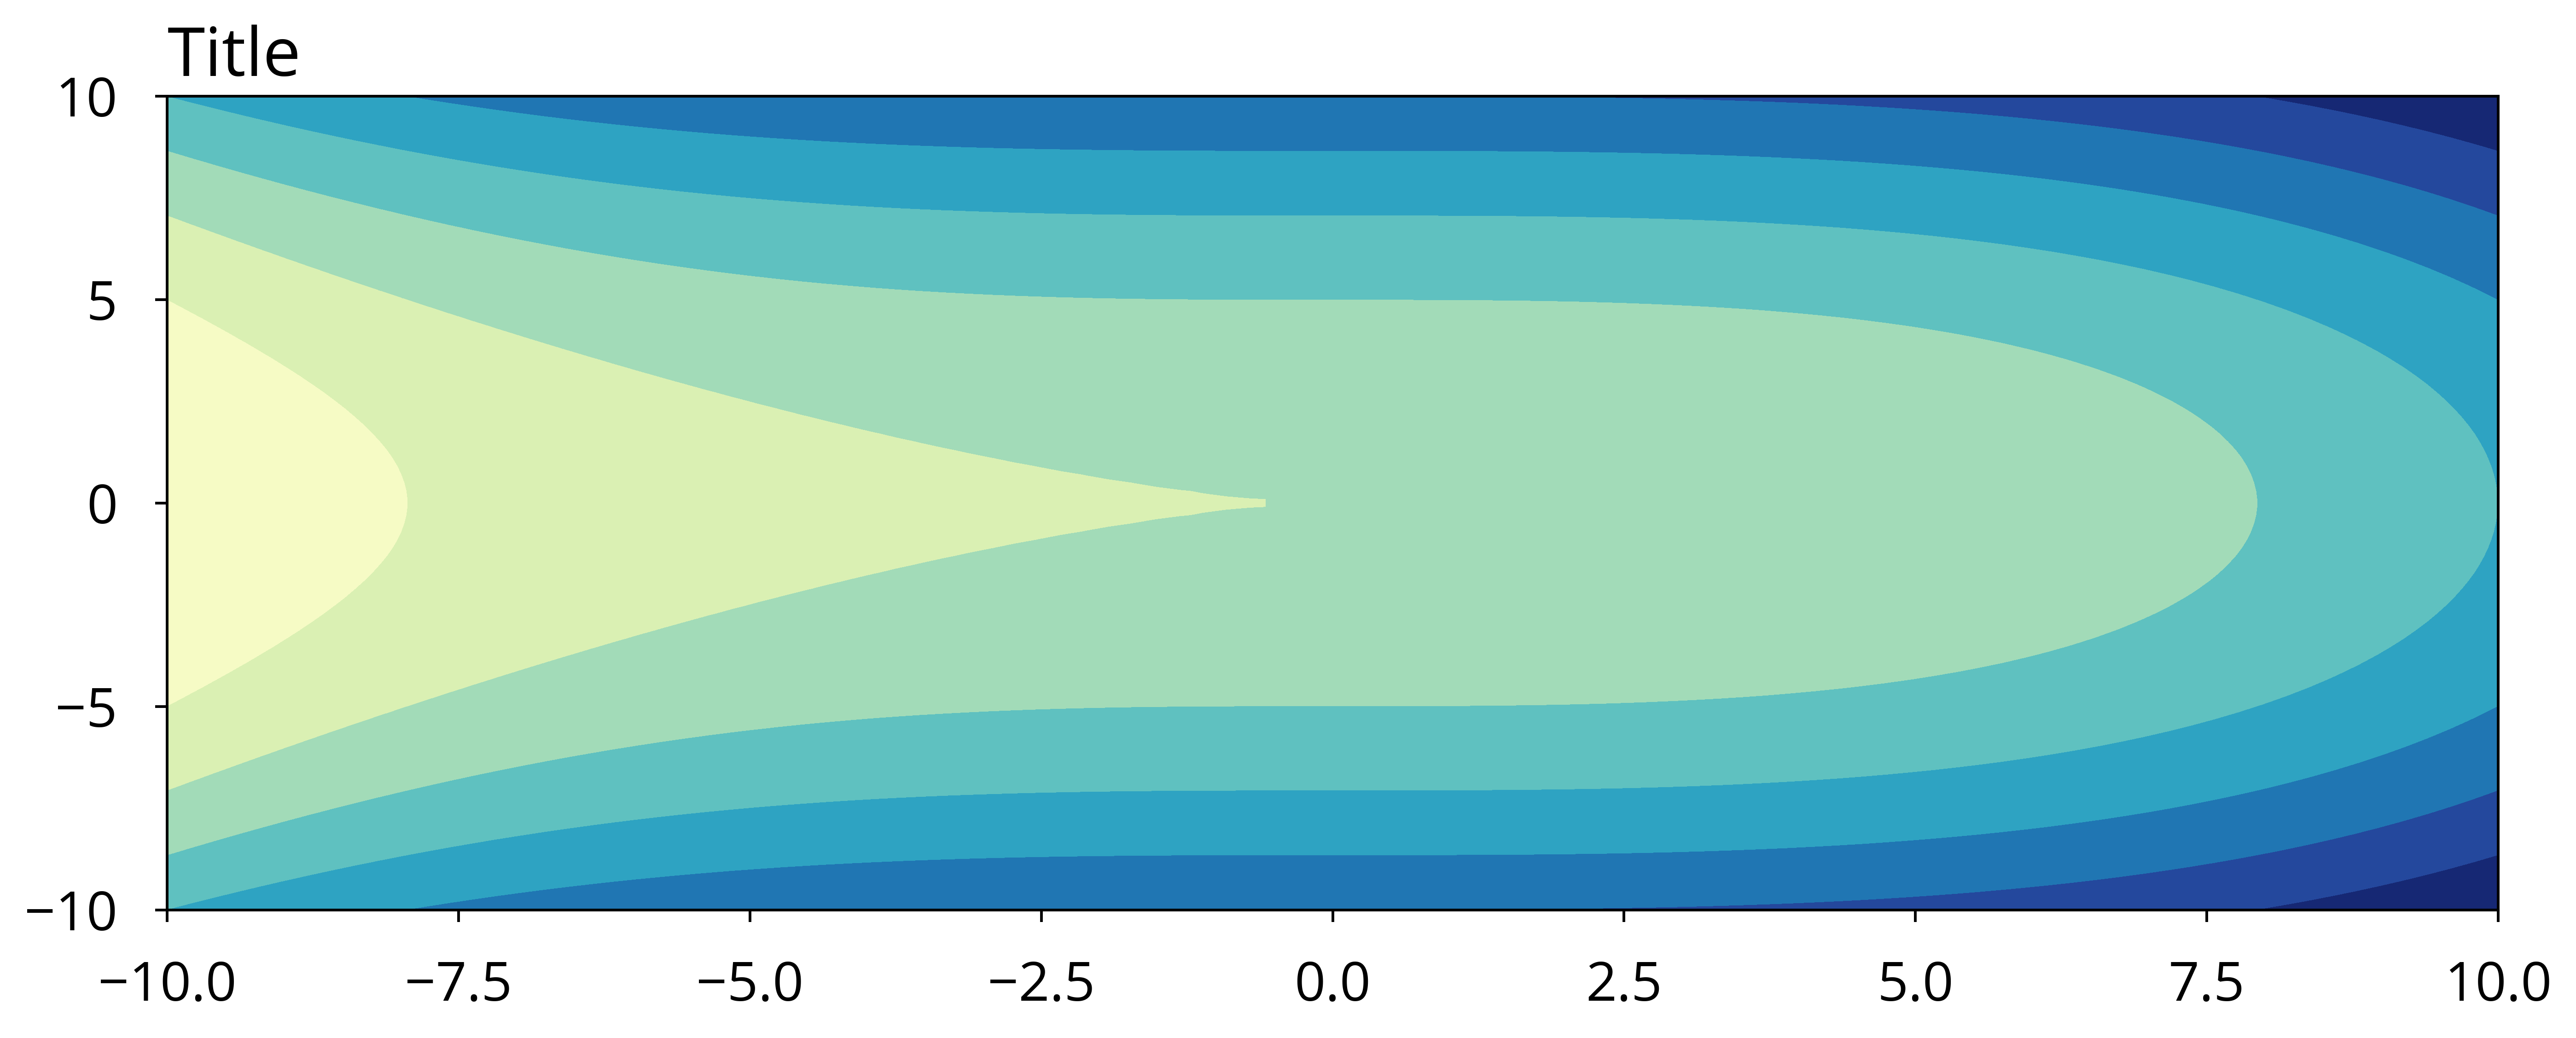
Description
Draws the contours of a 3D function.
Arguments
x: x-coordinates of the points where z is evaluated.y: y-coordinates of the points where z is evaluated.z: function or 2D-array of values where a function was evaluated givenxandyvalues.fill: whether to fill the contour plot.*args: positional arguments passed to Matplotlib's contour / contourf function.**kwargs: keyword arguments passed to Matplotlib's contour / contourf function.
Example
x = y = np.linspace(-10, 10, num=100)
f = lambda x, y: 0.5 * x**3 + 10.0 * y**2
plot = pl.Plot('Title')
plot.contour(x, y, f, fill=True)
errorbar(self, x, y, errors = None, vertical = True, *args, **kwargs)
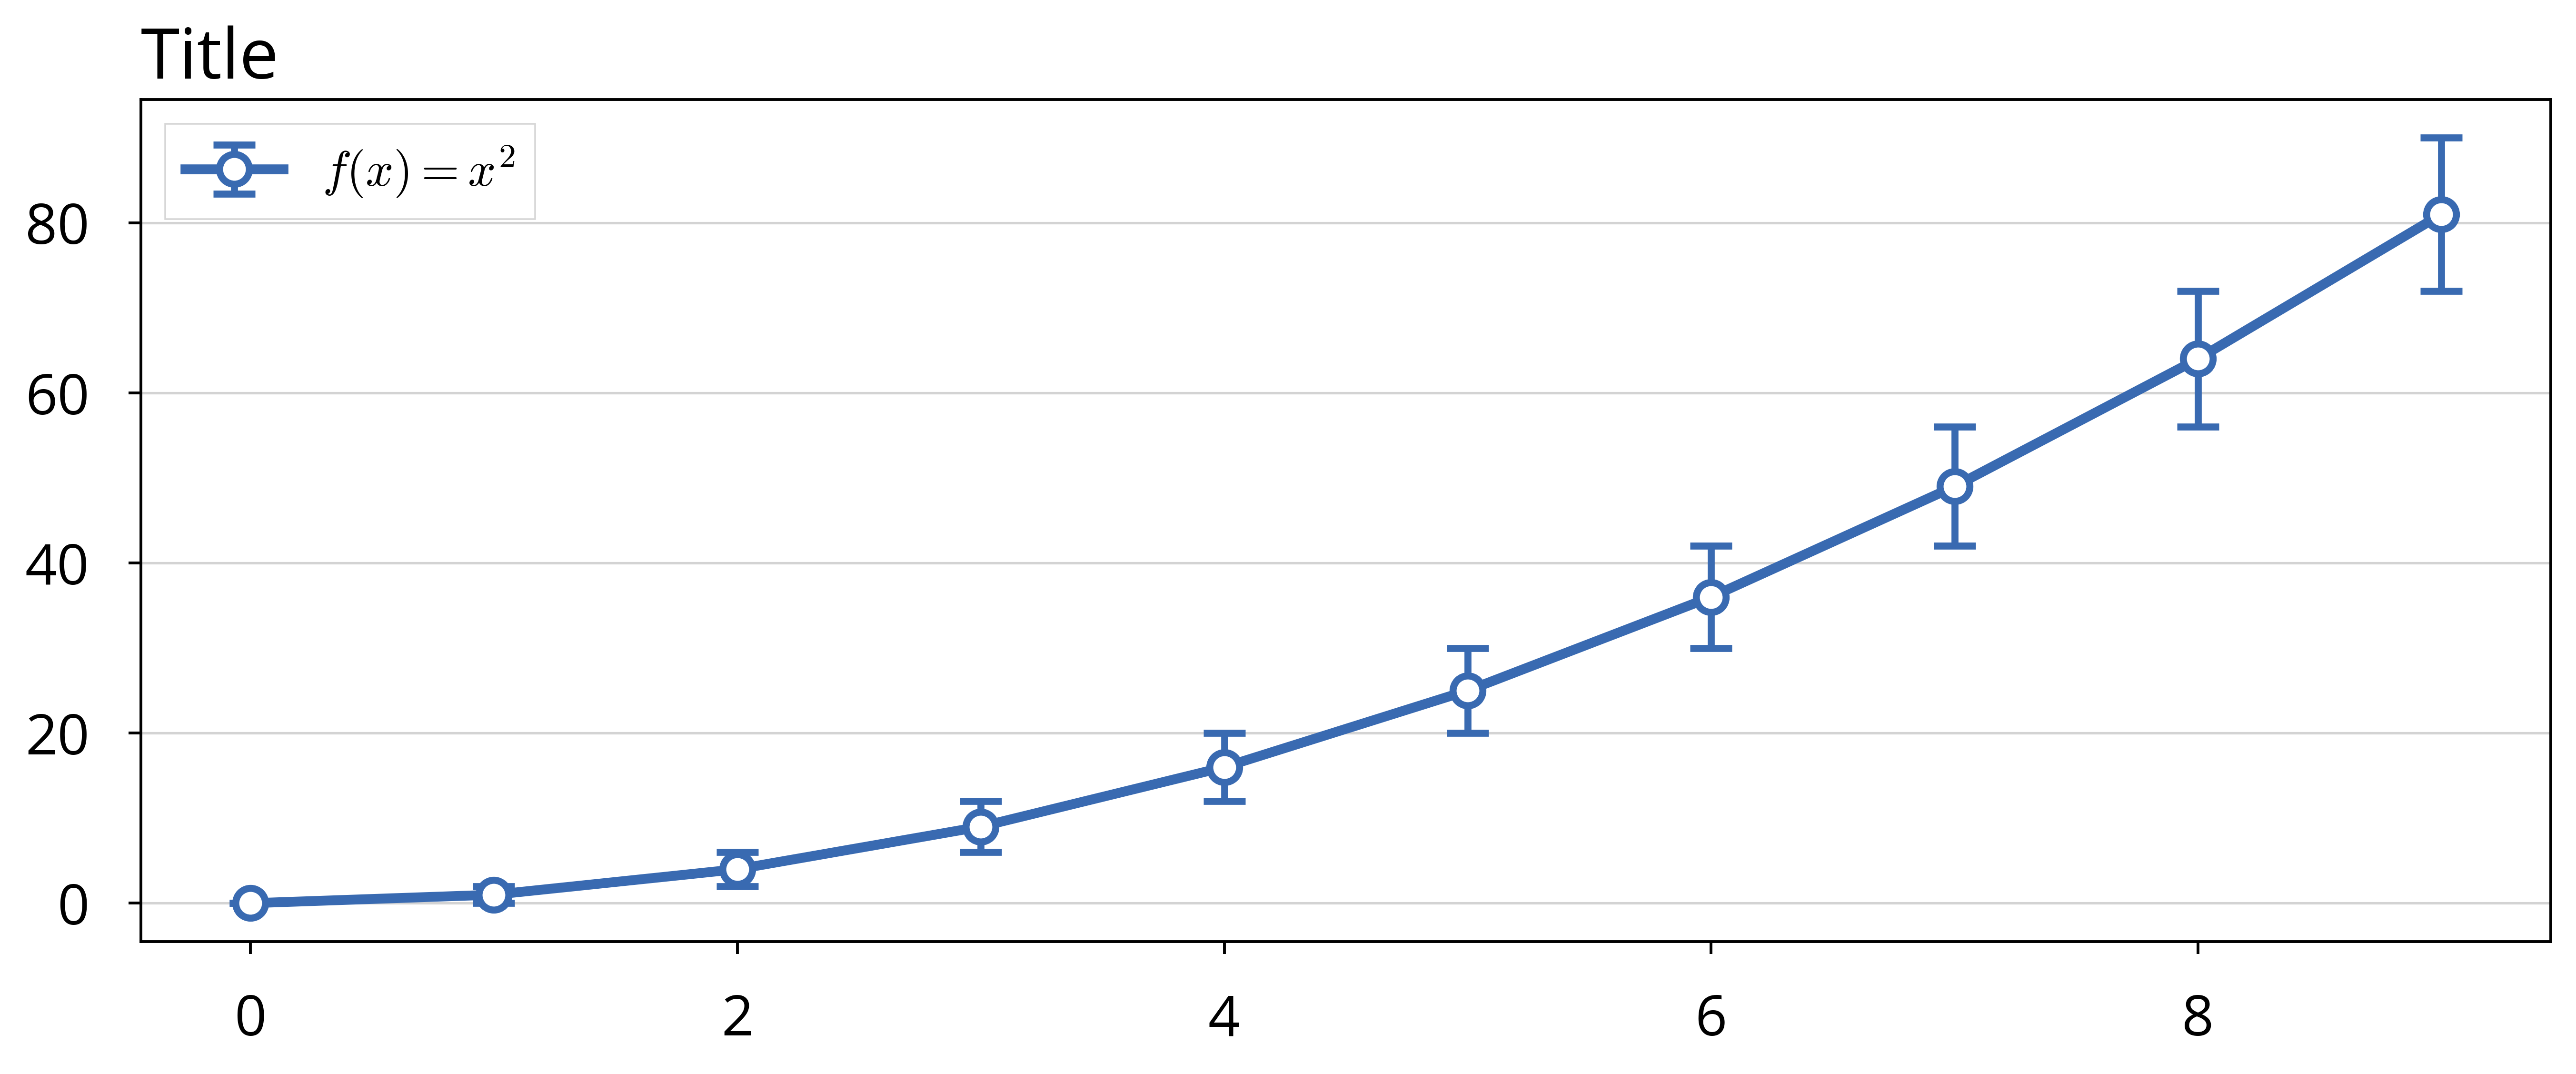
Description
Like plot, but also adds error bars on the points.
The size of the error bars is given by errors (a list).
Arguments
x: x-coordinates of the points to plot.y: y-coordinates of the points to plot.errors: list of error sizes of lengthlen(x).vertical: whether error bars are drawn vertically or horizontally.*args: positional arguments passed to Matplotlib's errorbar function.**kwargs: keyword arguments passed to Matplotlib's errorbar function.
Example
x = np.arange(10)
plot = pl.Plot('Title')
plot.errorbar(x=x, y=x**2, errors=x, label=r'$f(x) = x^2$')
fancybox(self, x, y, width, height, style = 'round', fill = None, color = None, alpha = 0.5, linewidth = 1.5, *args, **kwargs)
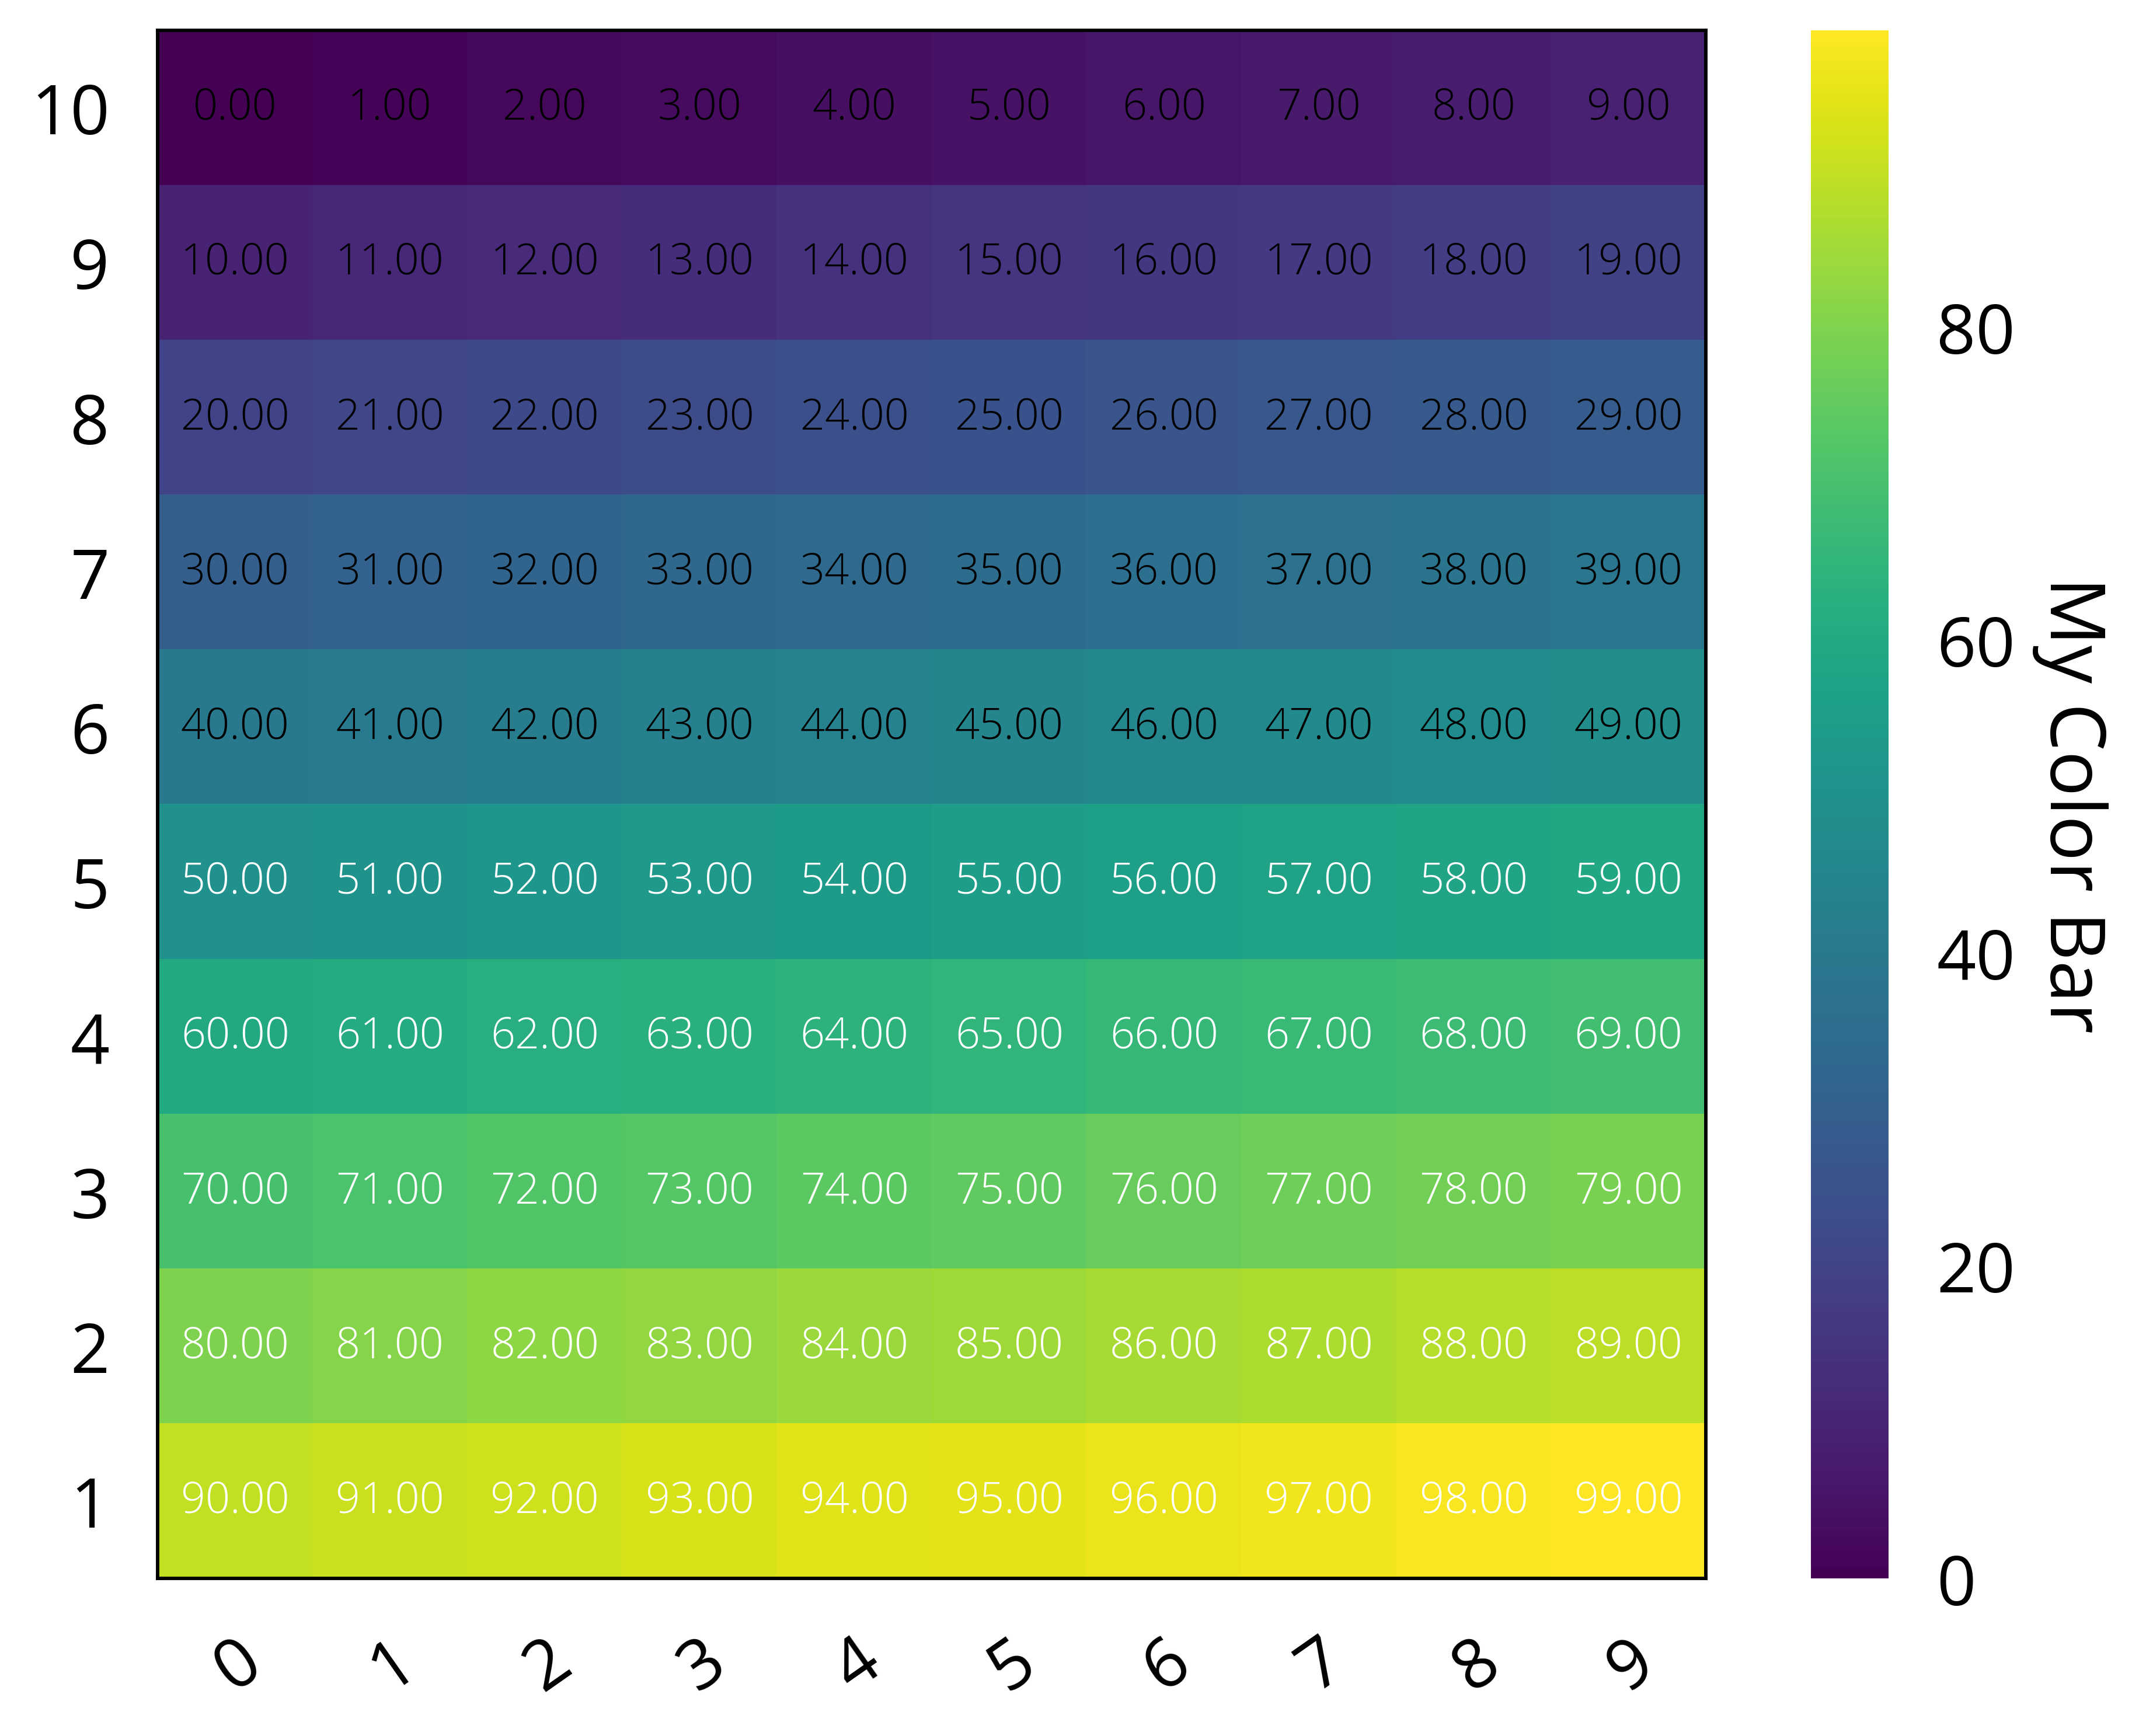
heatmap(self, heatvalues, xlabels = None, ylabels = None, show_values = False, cbar_title = '', *args, **kwargs)
Description
Draws a heatmap given an array of heat values.
Arguments
heatvalues: 2D grid to plot. (list of list or np.array)xlabels: list of names.ylabels: list of names.show_values: bool of whether to write values inside heat box.cbar_title: title of the color bar.*args: positional arguments passed to Matplotlib's imshow function.**kwargs: keyword arguments passed to Matplotlib's imshow function.
Keyword arguments of interest:
interpolation: nearest / kaiser / hanning / gaussian / spline16
Example
values = np.arange(100).reshape(10, 10)
plot = pl.Plot(height=3900.0, width=7200.0)
plot.heatmap(
    heatvalues=values,
    xlabels=[str(x) for x in range(10)],
    ylabels=[str(10 - x) for x in range(10)],
    show_values=True,
    cbar_title='My Color Bar',
)
numpy(self)
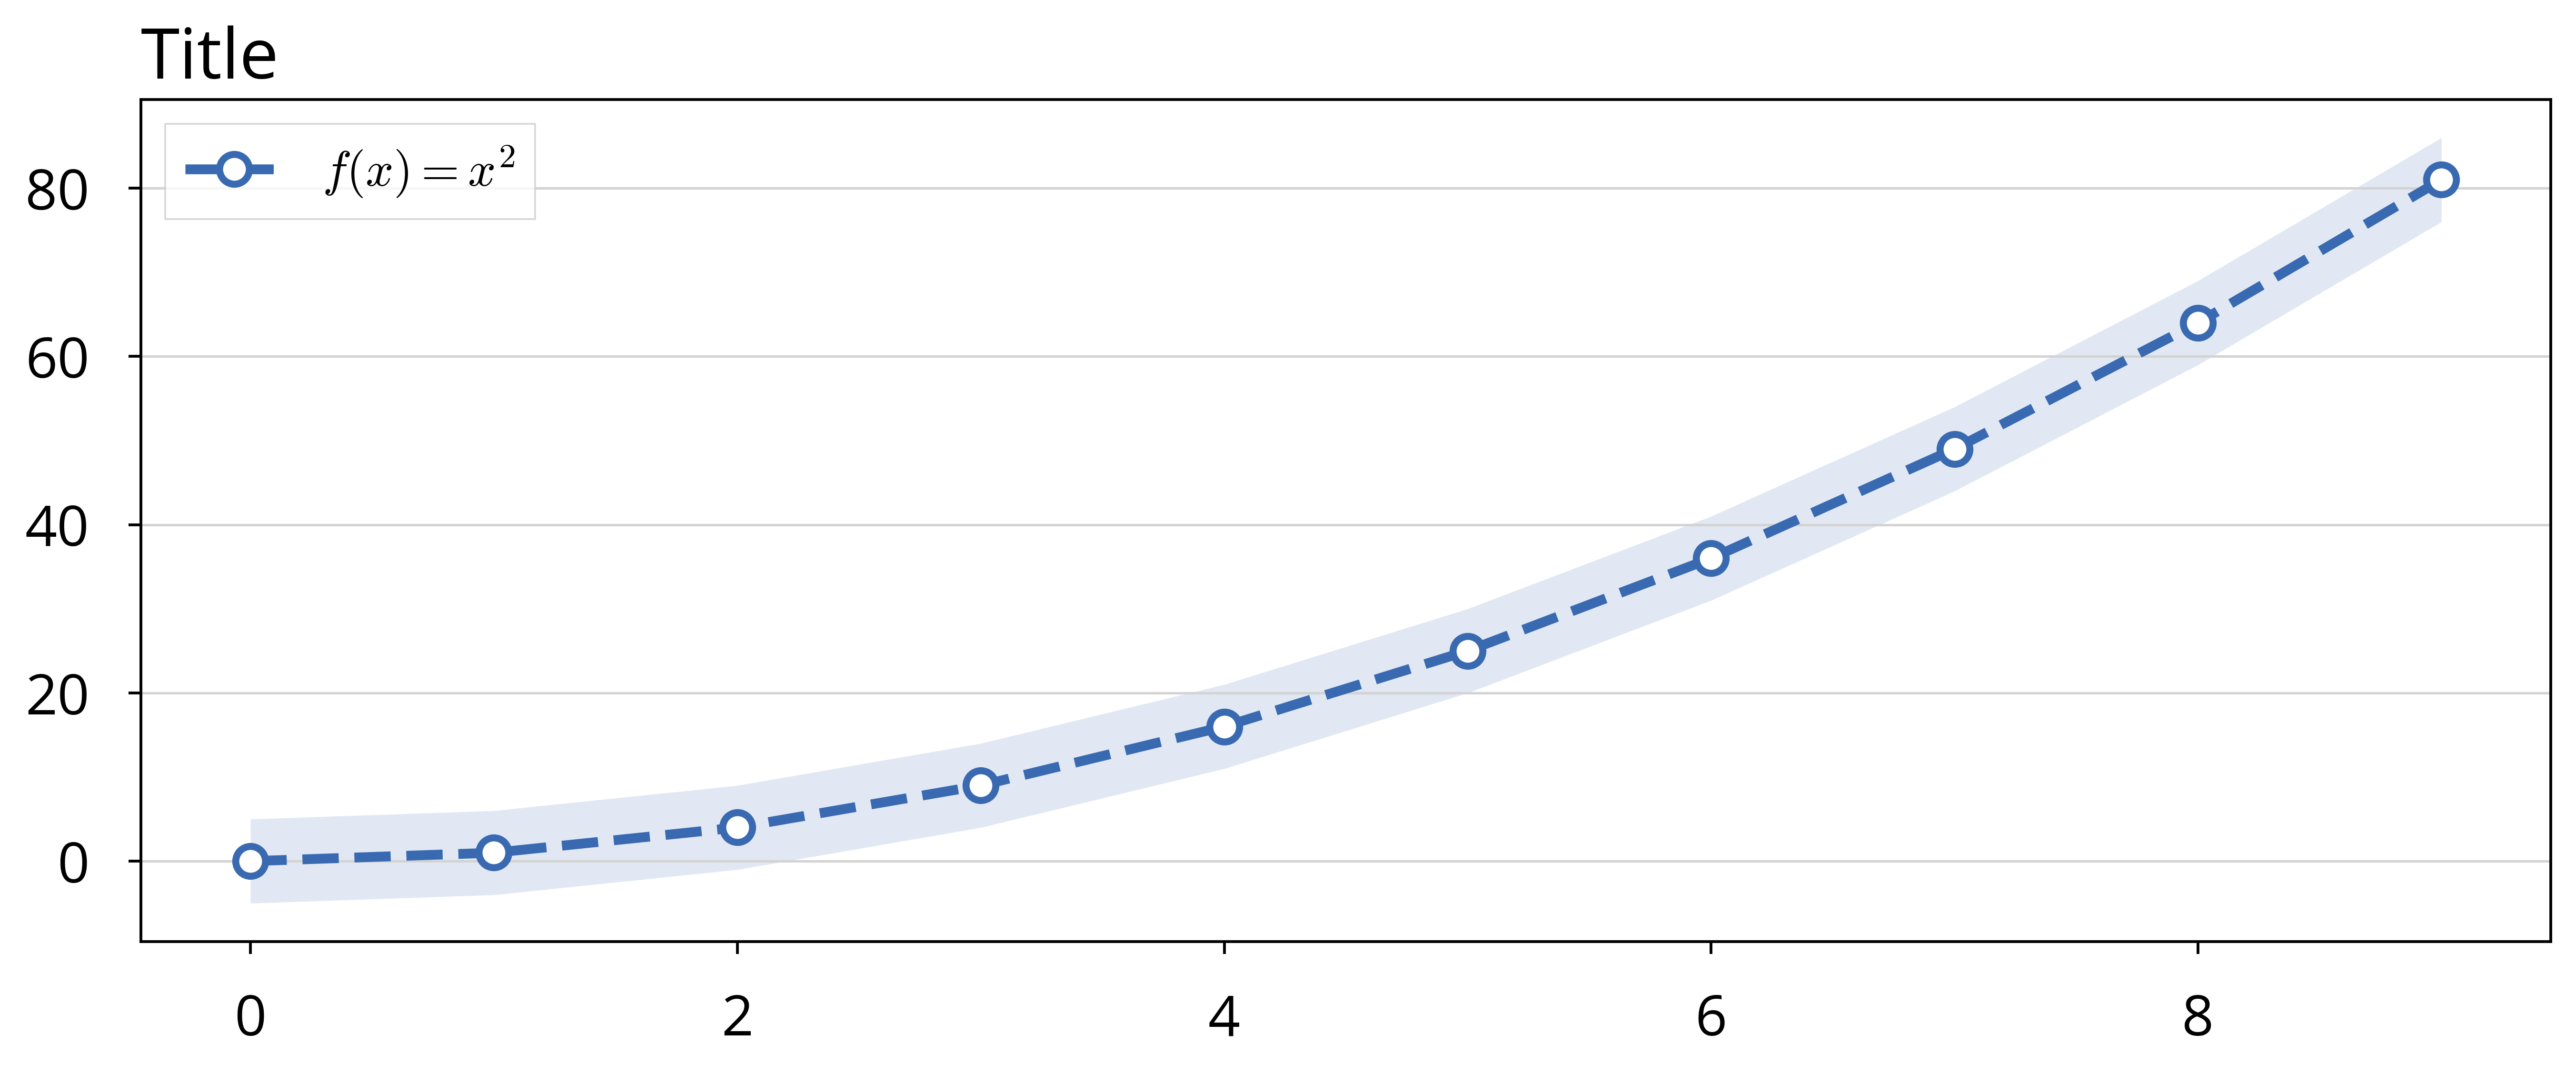
plot(self, x, y = None, jitter = 0.0, smooth_window = 0, smooth_std = True, *args, **kwargs)
Description
Plots a line defined by points in x (and y).
Arguments
x: x-coordinates.y: y-coordinates, if None thenxis used asyandxisrange(0, len(x)).jitter: Pointwise or float value for shading around curve.*args: positional arguments passed to Matplotlib's plot function.**kwargs: keyword arguments passed to Matplotlib's plot function.
Example
x = np.arange(10)
plot = pl.Plot('Title')
plot.plot(x=x, y=x**2, jitter=5.0, label=r'$f(x) = x^2$', linestyle='dashed')
rectangle(self, x, y, width, height, fill = None, color = None, alpha = 0.5, linewidth = 1.5, *args, **kwargs)
save(self, path, bbox_inches = 'tight', **kwargs)
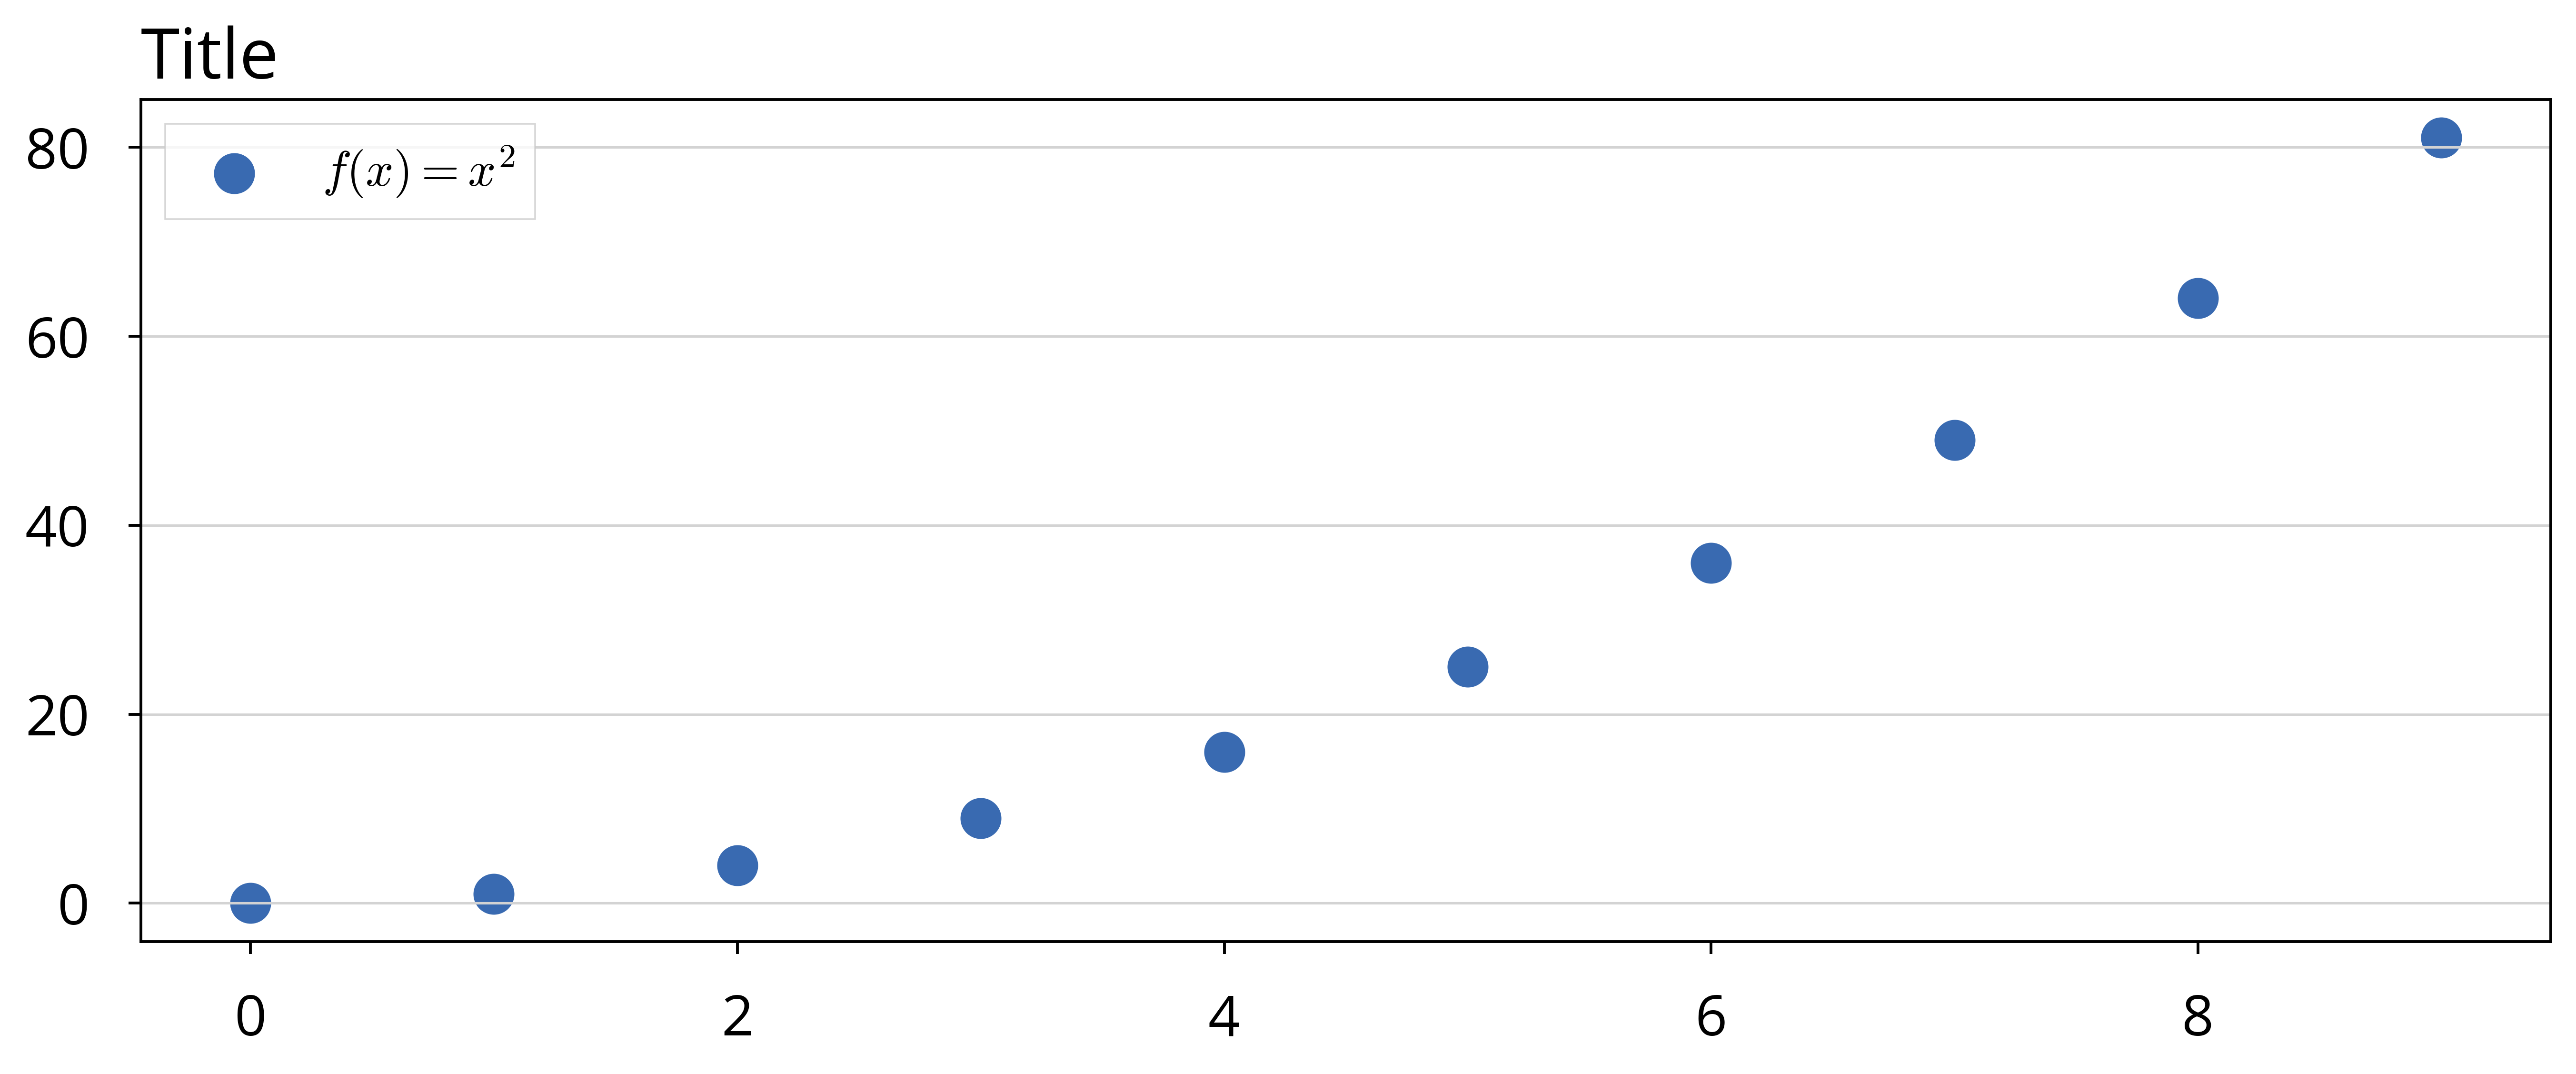
scatter(self, *args, **kwargs)
set_axis(self, x = '', y = '')
set_colormap(self, cm)
set_dimensions(self, height = None, width = None)
set_dpi(self, dpi)
set_font(self, name)
set_grid(self, axis = 'full', granularity = 'fine')
Sets a fine, light gray background grid.
axis values: full, vertical, horizontal, none. granularity: coarse, fine
set_legend(self, loc = 'best', title = None, show = True, inset = True, ncol = 1, alpha = 0.8, round_corners = False, **kwargs)
set_lims(self, x = None, y = None, z = None)
Expects (min_val, max_val) tuples for each arguments, where vals can be none to re-use current ones.
set_notation(self, x = None, y = None)
set_palette(self, palette, num_colors = 8)
set_scales(self, x = None, y = None, z = None)
Possible values: 'linear', 'log', 'log2', 'symlog', 'symlog2', 'logit'
set_subtitle(self, *args, **kwargs)
set_title(self, title, loc = 'center', x = None, y = 0.98, text_obj = None, **kwargs)
Description
Sets the title of the plot.
Arguments
title: Text of the title.loc: Location of the title.x: x-coordinate of the title.y: y-coordinate of the title.font: Optional font name string.text_obj: A text object where the title is set.
Example
plot = pl.Plot('Title')
plot.set_title('New and Much Longer Title', loc='right', x=0.9, y=0.92)